Row Count Report
Row count reports report the number of stories that match the filters defined for the report. When you add groups to the report, the report displays a story total for each group. You can display the results of a row count report as a table, bar chart, column chart, or pie chart.
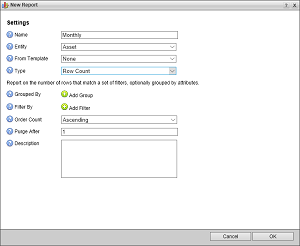
1.In the New Report dialog box, use the Report Type menu to select Row Count.
The New Running Order dialog box displays the Row Count report options.
2.In the Group By section, click or tap  Add Group to add a group to the report.
A column selection list opens in the Group By section.
![]()
3.Use the Column list to select a column that contains the information that you want to use to group the report results.
The report results will display a count for each distinct value in the selected Group By column. When creating the report, Streamline takes all the assets or work order that fit the report criteria and groups them. For example, selecting the Station field will group assets by Station. Additional sub-diving of the groups can be done by adding more fields. For example, select Station as the first field to group by, and then select Ingested By as the second field to group by. If there are 3 stations and 4 users, this gives 12 different bars to display on a graph.
4.To add additional Group By columns to a report repeat steps 2 and 3.
The Group By section displays the selected columns in the order that they will group results in the report.
5.Use the following icons to manage the Group By columns selected for a report:
• — click or tap this icon to delete the associated Group By column from the report.
• — click and drag this icon to move the associated Group By column to a new position in the grouping order.
6.In the Filter By section, click or tap  Add Filter to add a filer the report. Report results will only include the stories that match all the defined filters in the order they are displayed in the Filter By section.
A filter definition opens in the Filter By section.
![]()
7.Use the Field list to select the field that contains the information to filter.
8.Use Type to select the type of value that you want to filter for the selected field.
The Value field updates to match the selected Type.
9.Use the Value field to set a value for the selected Type.
Some Types do not require that you enter or select a Value.
10.Whey you want a report to contain results that do not match a defined filter, select the Not check box associated with the filter.
11.To add additional filters to a report, repeat steps 6 and 10.
Report results will only include the stories that match all the defined filters in the order they are displayed in the Filter By section.
12.Use the Order Count list to select the order in which to sort report results based on the reported row counts.
13.Enter in the Purge After box the number of days that Streamline saves report results.
Streamline deletes report results that are older than the set Purge After time.
14.Enter in the Description box a description of the report.
15.Click or tap OK.
Streamline adds the new report to the Report Manger panel.