After creating a trending or directed social poll, you must start the poll to gather results. You can view poll results as a bar chart or a pie graph.
1. In the Social Polls panel, double-click or double-tap the poll for which to view results.
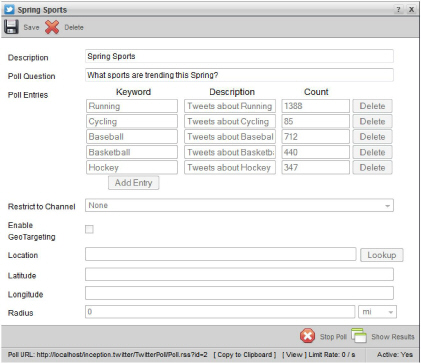
The Poll Editor panel opens displaying the properties of the selected poll.
2. In the bottom toolbar, click or tap the  Start Poll icon.
The Start Poll icon changes to the  Stop Poll icon. Also, the Active column in the Social Polls panel changes to Yes. While a poll is active, Inception continually updates the poll results every 20 seconds.
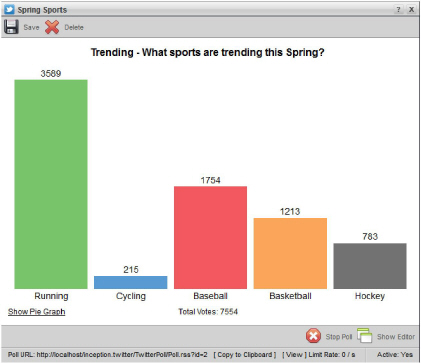
3. In the bottom toolbar, click or tap the  Show Results icon to view the poll results as a bar graph.
A bar graph of the poll results opens in the Poll Editor panel. Each bar in the bar graph represents an entry in the Poll Entries table.
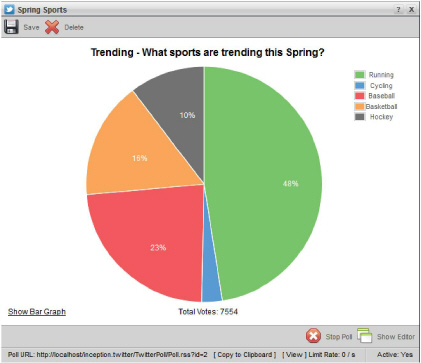
4. Click or tap the Show Pie Graph link to view the poll results as a pie graph.
A pie graph of the poll results opens in the Poll Editor panel. Each sector in the pie graph represents an entry in the Poll Entries table.
5. Click or tap the Show Bar Graph link to view the poll results as a bar graph. You can also click or tap the  Show Editor icon in the bottom toolbar to return to the poll properties.
The graph link toggles between Show Bar Graph and Show Pie Graph. The show icon  toggles between Show Editor and Show Results.
6. To stop updating poll results, click or tap the  Stop Poll icon in the bottom toolbar.
The Stop Poll icon changes to the  Start Poll icon. Also, the Active column in the Social Polls panel changes to No.
For More Information on...
• connecting to the RSS feed from a poll, refer to the section Connect to Social Poll Results RSS Feed.
• editing the properties of a polls, refer to the section Edit a Social Poll.
• deleting a poll, refer to the section Delete a Social Poll.